File:Hispanic and Latino Americans by state.svg

Size of this PNG preview of this SVG file: 800 × 396 pixels. Other resolutions: 320 × 158 pixels | 640 × 317 pixels | 1,024 × 506 pixels | 1,280 × 633 pixels | 2,560 × 1,266 pixels | 1,199 × 593 pixels.
Original file (SVG file, nominally 1,199 × 593 pixels, file size: 81 KB)
This image should always reflect the most recent version. Feel free to update it when needed.
|
Summary
| Description |
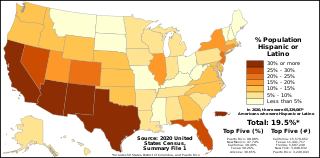
English: The map above shows the proportion of Americans who are either Hispanic or Latino in each U.S. state, the District of Columbia, and Puerto Rico according to the official results of the 2020 United States Census. The data can be found here.
This file should next be updated when the 2021 Vintage Racial and Ethnic Population Estimates are released on the statewide level, currently expected to occur in June 2022. Legend 30% or more
25% - 30%
20% - 25%
15% - 20%
10% - 15%
5% - 10%
Less than 5% |
| Date | |
| Source | Own work |
| Author | Abbasi786786 |
Licensing
I, the copyright holder of this work, hereby publish it under the following license:
This file is licensed under the Creative Commons Attribution-Share Alike 4.0 International license.
- You are free:
- to share – to copy, distribute and transmit the work
- to remix – to adapt the work
- Under the following conditions:
- attribution – You must give appropriate credit, provide a link to the license, and indicate if changes were made. You may do so in any reasonable manner, but not in any way that suggests the licensor endorses you or your use.
- share alike – If you remix, transform, or build upon the material, you must distribute your contributions under the same or compatible license as the original.
File history
Click on a date/time to view the file as it appeared at that time.
| Date/Time | Thumbnail | Dimensions | User | Comment | |
|---|---|---|---|---|---|
| current | 09:56, 7 July 2023 | | 1,199 × 593 (81 KB) | wikimediacommons>Illchy | File uploaded using svgtranslate tool (https://svgtranslate.toolforge.org/). Added translation for id. |
File usage
The following page uses this file: